This is the way I convert tick data into the aggregated form (OHLCV bars).
tick2bar() function assumes you have already imported your tick data into Matlab. If you haven’t and your tick data still resides just in a text file then you need to import them via an import function such the csvread(), textscan() or dlmread(). Check Matlab’s ways to import text files or low level I/O text import.
Arguments for tick2bar() function are:
- dates – vector in datetime data type
- price – vector in arbitrary numeric type
- amount – vector in arbitrary numeric type (this value is traded volume corresponding with particular tick/price)
- barlenght – integer (this option sets duration of a bar such that each bar has a duration of barlenght bartype units)
- bartype – one of the character ‘s’, ‘m’, ‘h’, ‘d’, ‘M’, ‘Y’ (this option is just the unit for barlength scalar)
So for 10 minute bars output we simply choose barlenght = 10 and bartype = ‘m’.
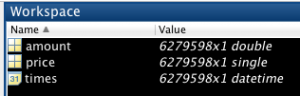
Your input should look something like this:
Output from the tick2bar() has two components – datetime vector and OHLCV matrix.
Example
Suppose we want to convert tick data into forementioned 10 minutes bars, so we call the function as follows:
[times,OHLCV] = tick2bar(times,price,amount,10,'m');
Download tick2bar().